
How the Safee Tracking System Turns Data into Fleet Insights

As fleets expand and more vehicles generate GPS and sensor data, daily operations become harder to manage through location tracking alone. Fleet managers must coordinate vehicles, drivers, routes, compliance requirements, service levels, and operating costs while maintaining a clear view of performance.
The Safee Tracking System supports real-time fleet monitoring by turning raw vehicle tracking data into clear, actionable fleet insights. Instead of reviewing disconnected records, operations teams can use current and historical data to identify exceptions, compare performance, and make better-informed decisions about vehicles, routes, and resources.
Powered by the TDA Platform, or Tracking Data Analyzer, Safee combines dynamic data tracking, configurable cloud-based dashboards for fleet performance, and detailed reporting within one connected vehicle tracking system. The platform organizes real-time fleet data into practical views that help managers understand what is happening across their operations without manually compiling information from multiple tools.
Built on the Elastic Stack—including Elasticsearch, Logstash, and Kibana—the TDA Platform supports the collection, processing, analysis, and presentation of fleet information. Interactive dashboards, maps, charts, filters, and scheduled reports provide structured data visualization for fleets, helping users explore trends and investigate operational events from different perspectives.
This connected fleet data analytics platform is suited to logistics, transportation, construction, oil and gas, and public-sector fleets across the Middle East, North Africa, and other operating regions. Its value comes from converting complex data streams into information that operations, safety, maintenance, and management teams can understand and act on.
How smarter reporting supports fleet growth
Collecting vehicle tracking data is only the first step in managing a growing fleet. Its real value comes from organizing that information into reports that help managers understand performance, investigate operational exceptions, and decide where vehicles, drivers, routes, or resources require attention.
Safee’s Tracking Data Analyzer (TDA) turns current and historical fleet information into structured real-time fleet insights. Managers can build configurable reports, schedule recurring delivery, and review performance across selected vehicles, drivers, routes, locations, and time periods.
Rather than relying on fixed summaries, the TDA Platform supports filters, multi-level data aggregation, comparative views, and condition-based reporting. These capabilities help users identify recurring patterns, examine unusual results, and convert complex records into actionable fleet insights for operations, safety, maintenance, and management teams.
This analytical depth distinguishes Safee from basic data tracking services that primarily collect and display records. By connecting reporting with the wider fleet data system, Safee helps teams compare utilization, journeys, driver activity, fuel-related information, and operational events within one reporting workflow.
The fleet reporting module also supports scheduled and customized reporting, reducing the need to compile recurring updates manually. Better reporting does not guarantee lower costs or business growth on its own, but it gives decision-makers clearer evidence for improving resource allocation, service delivery, and fleet planning.
Also read: Safee Journey Management System for Smarter Fleet Safety
The role of Safee TDA in advanced fleet data analytics
A centralized monitoring platform creates real value only when fleet teams can interpret the information it collects. Location records, sensor readings, journey events, and driver data remain difficult to use when they are stored separately or presented without clear analysis.
Safee’s TDA serves as the analytical engine of the Safee Tracking System. It organizes high volumes of vehicle tracking data and converts them into clear actionable fleet insights, helping managers identify patterns, investigate exceptions, and make better-informed operational decisions.
Built on technologies from the Elastic Stack, including Elasticsearch and Logstash, the TDA Platform functions as a connected fleet data analytics platform for analyzing and presenting operational information. Its reporting and visualization tools bring data from vehicles, drivers, routes, locations, and time periods into one structured environment for data visualization for fleets.
With Safee TDA, fleet managers can:
- Centralize fleet data: Review tracking, journey, vehicle, and operational records through one analytical environment instead of switching between disconnected tools.
- Generate multi-level reports: Aggregate information by vehicle, driver, route, region, time period, or other available parameters to compare performance and operational trends.
- Build interactive dashboards: Combine tables, charts, maps, and filters to present the metrics most relevant to operations, safety, maintenance, or management teams.
- Create condition-based reports: Apply defined rules to highlight unusual events, recurring deviations, or records that require further investigation.
- Investigate performance in greater detail: Move from summary views to more specific records to understand when, where, and under what conditions an issue occurred.
- Share reports with stakeholders: Provide relevant dashboards and visualizations to managers, compliance teams, contractors, or other authorized users.
- Schedule report delivery: Configure recurring reports to reach selected recipients at defined intervals, reducing the need for manual preparation.
- Export data for further use: Export supported reports and visualizations in formats such as Excel or CSV for archiving, comparison, or use in other business workflows.
When connected with Safee’s alarms and alerts system, condition-based analysis can also support faster review of events that fall outside the fleet’s configured operating rules.
These capabilities move fleet reporting beyond basic data collection. Safee TDA gives managers a structured way to interpret fleet information, compare performance, and support operational planning. Any improvement in cost, efficiency, or resource use still depends on the quality of the connected data and the actions taken by the fleet team.
Also read: Why Small Businesses Need Fleet Management Solutions
How Safee TDA processes data in real time
The Safee TDA Platform processes vehicle tracking data as it is transmitted from compatible GPS devices, onboard sensors, and other connected fleet systems. Instead of relying only on end-of-day summaries, the platform can organize incoming location records, journey events, alarms, and sensor readings while operations are still in progress.
This flow begins with real-time vehicle telemetry generated by the connected assets. Logstash and Beats can receive, filter, and enrich the incoming information before Elasticsearch indexes it for search and analysis. Kibana then presents the processed data through interactive dashboards, maps, charts, and filters that help users investigate current events and historical patterns.
Through this dynamic data tracking workflow, fleet managers can review real-time fleet data alongside earlier records to understand what changed, where it happened, and which vehicle, driver, route, or operating period requires attention. Safee’s live vehicle tracking capabilities provide the operational location context, while the TDA Platform adds deeper analysis and visualization.
The platform’s real-time fleet analytics tools can support several tasks, including:
- Monitoring recent vehicle and journey activity
- Reviewing alarms and telemetry events
- Comparing vehicles, routes, drivers, or time periods
- Identifying unusual changes in operational performance
- Exploring fleet tracking statistics through filtered dashboards
- Preparing reports for operations, safety, maintenance, or management teams
For organizations evaluating real-time fleet data monitoring solutions, the value lies in connecting data collection with analysis. A stream of GPS and sensor records becomes more useful when managers can filter it, compare it with historical activity, and turn it into information that supports an operational response.
The distributed architecture behind the TDA Platform can also be configured to support growing fleets and increasing data volumes. Actual capacity and response performance depend on the deployment architecture, connected devices, update frequency, integrations, reporting workload, and infrastructure configuration. Scalability should therefore be planned around the fleet’s expected data requirements rather than presented as unlimited by default.
Request a demo of the Safee Tracking System to see how the TDA Platform can organize your fleet telemetry, dashboards, and reporting workflows.
Cloud-based dashboards for fleet performance
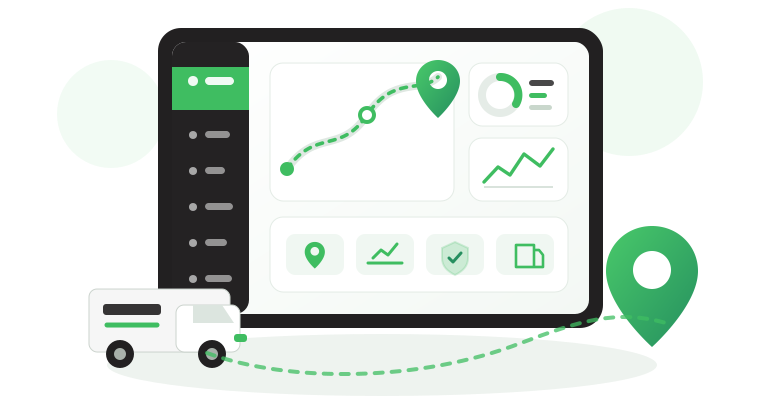
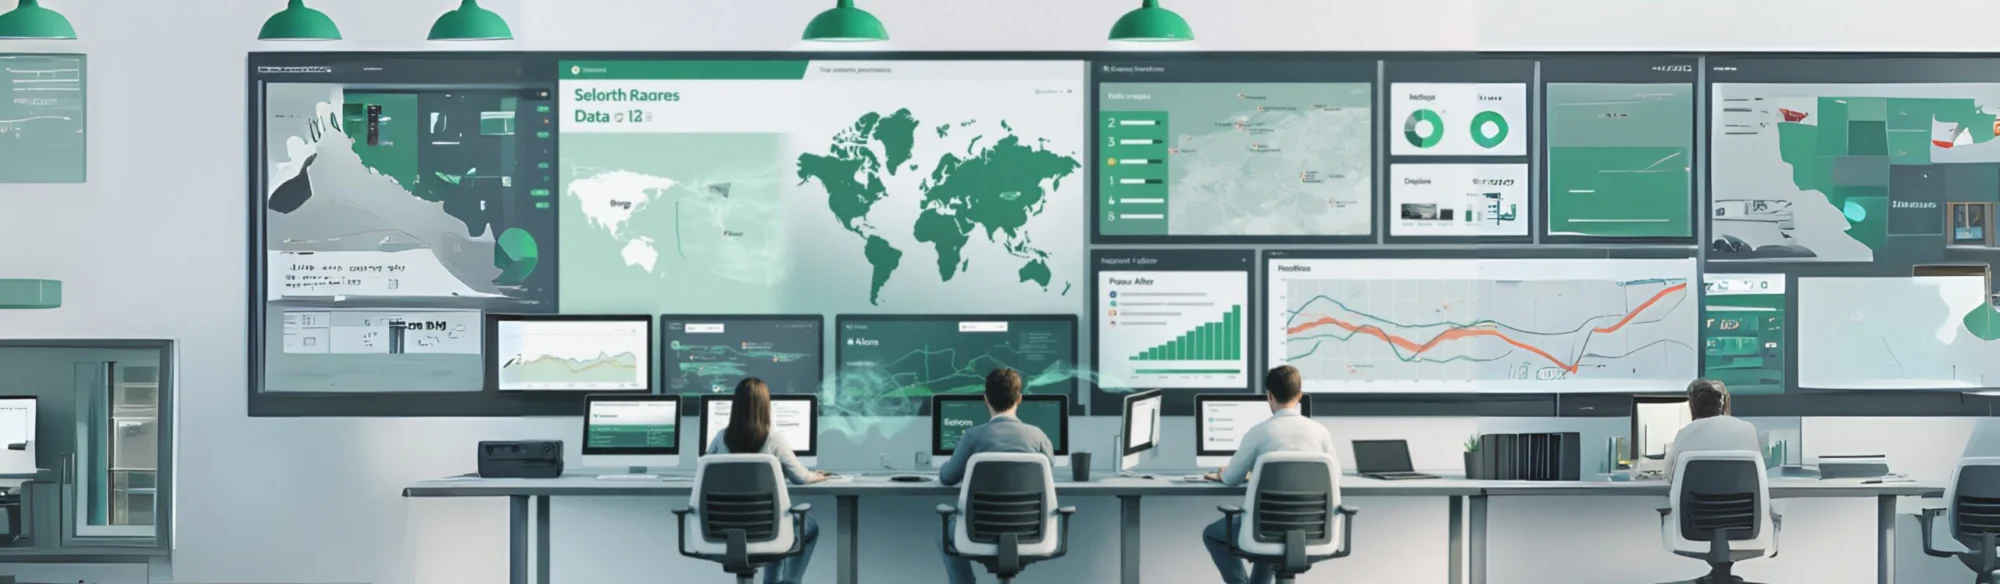
Safee’s cloud-based dashboards for fleet performance bring current and historical fleet information into one visual workspace. Through the TDA Platform, managers can review supported data such as vehicle locations, journey activity, fuel-related records, alarms, driver behavior, and utilization without relying on separate spreadsheets or static reports.
Each fleet performance dashboard can be configured around the information most relevant to a specific operational role. Logistics teams may focus on route progress, delivery activity, and vehicle utilization, while safety teams review driving events, alarms, and repeated violations. Management users can compare broader trends across vehicles, drivers, locations, and time periods.
Interactive filters, charts, maps, and tables allow users to move from a high-level overview to more detailed records. This makes the dashboard useful for both real-time fleet monitoring and historical analysis, helping teams understand not only what is happening now, but also how performance changes over time.
Safee’s fleet monitoring and insights capabilities provide operational context, while the fleet reporting module supports scheduled delivery of selected reports to relevant stakeholders. This reduces the need for repeated manual preparation and helps teams work from a more consistent fleet data system.
Because access is cloud-based, authorized users can review dashboards remotely through supported devices and browsers, subject to user permissions, connectivity, and system configuration. For organizations operating across multiple sites or countries, this can support more coordinated decision-making without requiring every team to work from the same physical location.
Why Safee’s tracking system uses elasticsearch?
The Safee Tracking System uses Elasticsearch within the TDA Platform because fleet analytics requires more than storing location records. The platform must search, filter, aggregate, and compare large volumes of vehicle tracking data while preserving the context needed for reporting and operational analysis.
1. Near-real-time search and analytics
Built on Apache Lucene, Elasticsearch is a distributed search and analytics engine designed to index and analyze structured, unstructured, numerical, time-series, and geospatial information in near real time. This makes it suitable for fleet workflows involving locations, journeys, sensor readings, alarms, and other time-sensitive operational events.
Within the TDA Platform, these capabilities support real-time fleet monitoring by allowing users to search recent records, filter events, and compare current activity with historical data. Actual processing and search latency depend on the deployment architecture, indexing configuration, infrastructure resources, and volume of incoming data.
2. Distributed architecture and data resilience
Elasticsearch organizes indexed data into shards that can be distributed across multiple nodes. Replica shards can provide additional resilience and search capacity when the cluster is configured correctly, helping the system continue serving data when individual infrastructure components encounter problems.
This architecture allows a Safee deployment to be planned around increasing numbers of vehicles, devices, users, and reports. It should not be described as scaling without limits or performance impact, because capacity depends on cluster design, storage, network performance, query complexity, retention policies, and data-update frequency.
3. Integration with kibana for fleet data visualization
Elasticsearch works with Logstash and Kibana as part of the Elastic Stack used by Safee TDA. Logstash supports data collection and enrichment, while Kibana provides the visualization layer through which authorized users can explore information using dashboards, charts, maps, tables, and filters. Safee’s published page confirms that its TDA Platform integrates Elasticsearch, Logstash, and Kibana for fleet-data processing and visualization.
This integration supports data visualization for fleets across reports such as:
- Trip and journey activity
- Vehicle utilization statistics
- Fleet resource-consumption records
- Geofence entry and exit events
- Driver and vehicle performance trends
Fleet managers can use these views to move from broad summaries to specific vehicles, drivers, routes, locations, or time periods. Combined with Safee’s fleet reporting module, the TDA Platform turns complex records into structured actionable fleet insights for operational review. Safee’s reporting environment includes trip, utilization, driver-safety, geofence, and resource-related report categories.
The value of Elasticsearch within Safee TDA therefore comes from combining search, aggregation, distributed processing, and visualization. Together, these capabilities help teams interpret fleet information more efficiently, but operational results still depend on data quality, platform configuration, and the decisions made from the findings.
Fleet safety analytics and proactive risk management
Fleet safety analytics helps managers identify recurring risk patterns instead of reviewing every driving event in isolation. Through the Safee Tracking System and TDA Platform, safety teams can analyze supported events such as speeding, harsh braking, rapid acceleration, excessive idling, geofence breaches, and unauthorized route deviations.
The platform can organize these records by driver, vehicle, route, location, or operating period. This allows managers to distinguish between an isolated event and a repeated pattern that may require further investigation, driver coaching, or changes to operating procedures.
Safee’s alarms and alerts system supports more than 50 configurable alarm types, with notifications available through SMS, email, or the application. When these alerts are connected with TDA dashboards, teams can review both the immediate event and its historical context rather than responding to a notification without supporting information.
Safee also provides driver-performance tools, including RAG-style reports that classify drivers according to violation-based scoring. These reports can help safety managers identify recurring behaviors, compare performance, define coaching priorities, and follow changes over time.
For regulated or high-risk operations, real-time fleet safety analytics can support:
- Reviewing driving violations and repeated risk patterns
- Investigating safety events by driver, vehicle, or route
- Prioritizing driver coaching and corrective action
- Maintaining records for internal reviews and audits
- Comparing safety performance across departments or contractors
- Tracking whether defined interventions are producing improvement
These tools support more proactive risk management, but they do not guarantee that incidents will be prevented or that legal compliance will be achieved automatically. Effective results still require appropriate alarm settings, accurate driver assignment, clear escalation procedures, training, and consistent management follow-up.
Also read: Safee Tracking System: Real-Time Fleet Data Made Simple
What vehicle tracking reports can you generate?
The Safee Tracking System and its TDA Platform convert current and historical vehicle tracking data into configurable vehicle tracking reports. Instead of reviewing disconnected records or manually combining spreadsheets, fleet managers can organize operational information through dashboards, filters, charts, maps, and scheduled reports.
This approach to data visualization for fleets helps operations teams compare activity, investigate exceptions, and turn raw records into actionable fleet insights. The reports available depend on the connected devices, sensors, modules, and data fields included in the deployment.
1. Trip reports
Trip reports provide a structured view of how each vehicle is used across individual journeys. Managers can review:
- Engine running time: Compare operating time with productive journey activity and identify prolonged idling.
- Departure and arrival times: Review punctuality and investigate recurring delays.
- Distance and mileage: Compare distances by vehicle, driver, route, or reporting period.
- Stop locations: Identify frequent, extended, or unauthorized stops.
- Journey duration and downtime: Examine where time is being lost during daily operations.
- Driver activity: Review available driving events and relate them to journey performance.
When connected with Safee’s driver management tools, trip records can also support broader vehicle performance data analysis by linking journey results with the assigned driver.
2. Geofence reports
Geofence reports show how vehicles interact with predefined operational zones such as depots, customer sites, warehouses, restricted areas, or service locations.
Fleet managers can use them to review:
- Entry and exit times for each zone
- Time spent inside a defined location
- Visit frequency by vehicle or driver
- Late arrivals or extended stays
- Activity across different branches, cities, or operating regions
These reports help teams validate service activity and investigate route or scheduling issues. They should not be treated as proof of delivery or regulatory compliance unless the required supporting records and procedures are also in place.
3. Vehicle utilization and consumption reports
Utilization reports help managers understand whether vehicles are being used effectively and where operating patterns require closer review. Depending on the connected modules and available data, reports may cover:
- Vehicle activity and availability
- Distance travelled and journey frequency
- Operating, idle, and inactive periods
- Fuel consumption and purchase records
- Repeated fuel-use anomalies
- Maintenance indicators and vehicle condition records
- Available cost records by vehicle, driver, or period
When integrated with Safee’s fuel tracking module, these reports can connect fuel information with journeys, routes, and vehicle activity. This gives managers more meaningful fleet tracking statistics than fuel totals viewed without operational context.
The data may help teams identify inefficient patterns, but it does not automatically prevent breakdowns or guarantee lower operating costs. Results depend on data accuracy, report configuration, and the actions taken after reviewing the findings.
4. Multi-level filters and data aggregation
The TDA Platform supports dynamic data tracking by allowing users to filter and compare information across multiple dimensions. Depending on the available records, managers can analyze reports by:
- Date or time period
- Vehicle or plate number
- Driver
- Trip or route
- City, region, or branch
- Geofence or custom location
- Vehicle group or department
These filters allow teams to move from a broad fleet overview to the specific records behind a result. Managers can compare periods, investigate recurring exceptions, and create dashboards for different operational or management requirements.
Safee’s fleet reporting module can also support report scheduling, delivery, and export for further analysis or stakeholder review. This creates a repeatable reporting workflow rather than requiring teams to rebuild the same analysis manually.
Request a demo of the Safee Tracking System to review the reports, filters, dashboards, and data sources most relevant to your fleet.
Also read: How Telematics Vehicle Tracking Is Redefining Modern Fleet Management?
Real-time fleet management system for trucking and logistics
Trucking and logistics operations require more than a map showing vehicle locations. Dispatch teams need to follow trip progress, review route exceptions, identify extended stops, monitor driver activity, and connect operational events with fuel, delivery, and vehicle-performance records.
The Safee Tracking System functions as a connected real-time fleet management system by bringing live tracking, configurable alerts, historical journeys, dashboards, and reports into one operational environment. Through the TDA Platform, managers can compare current activity with previous trips and investigate the conditions surrounding delays or unusual events.
Depending on the devices and modules connected to each vehicle, teams can review:
- Current vehicle location and operating status
- Journey and delivery-route progress
- Route deviations and geofence events
- Extended or unauthorized stops
- Speeding and other configured driving events
- Fuel readings and consumption patterns
- Vehicle utilization and trip history
- Cargo-related information where compatible monitoring modules are connected
Safee’s live vehicle tracking provides location, journey, and geofence context, while its alarms and alerts system can notify teams of configured events such as route deviations, geofence breaches, unsafe driving, or unauthorized movement.
For teams evaluating a trucking monitoring system, the value lies in connecting these events instead of reviewing them through separate tools. A dispatcher can identify a delayed vehicle, examine its location and stop history, review any relevant alerts, and compare the journey with previous activity before deciding how to respond.
When Safee’s fuel tracking module is included, managers can also relate available fuel readings and detected events to journeys, locations, idling, and operating periods. The accuracy and scope of this analysis depend on the selected fuel-data source, calibration, and installation configuration.
For applicable transport activities in Saudi Arabia, Safee’s wider vehicle-tracking platform supports WASL-related workflows. Regulatory applicability must be confirmed according to the fleet’s activity, vehicle category, and current authority requirements. Madinati should be described only in relation to the specific municipal implementations supported by Safee, not as a general UAE integration.
By bringing tracking, exceptions, dashboards, and reports together, Safee provides trucking and logistics teams with more structured data tracking services. The platform supports faster investigation and better coordination, while actual improvements in delivery reliability, fuel control, or compliance still depend on data quality and operational follow-up.
From vehicle data to actionable fleet insights
Collecting more vehicle tracking data does not automatically improve fleet performance. The information becomes valuable when managers can identify what changed, determine why it matters, and connect the finding to a clear operational response.
The Safee TDA Platform supports this process through data aggregation, configurable filters, condition-based analysis, and visual dashboards. Instead of presenting every GPS point, sensor reading, or alarm as an isolated record, it organizes related information into actionable fleet insights that can be reviewed by vehicle, driver, route, location, or time period.
Consider fuel performance as an example. A basic report may show the total quantity consumed by each vehicle. A more useful vehicle performance data analysis can compare available fuel information with:
- Distance travelled
- Route and journey activity
- Idling periods
- Vehicle utilization
- Driver assignment
- Refuelling locations
- Previous operating periods
- Similar vehicles or routes
This context helps managers determine whether an unusual result may be related to route conditions, vehicle use, idling, data quality, or another factor that requires investigation. It does not automatically identify the cause or produce a guaranteed recommendation; the final decision remains with the operations and fleet teams.
Safee’s real-time fleet data monitoring solutions also allow managers to move from an alert or dashboard result to the supporting records behind it. A safety team may investigate repeated harsh-driving events, while an operations manager reviews recurring route delays and a maintenance team examines declining vehicle availability.
The fleet monitoring and insights module adds map-based operational context, while Safee TDA supports deeper reporting and analysis. Together, they help managers turn fleet records into structured questions, evidence, and follow-up actions rather than leaving teams to examine raw data manually.
Request a personalized demonstration of the Safee Tracking System to review how your tracking, telemetry, alerts, dashboards, and reporting data can be organized around your fleet’s operational priorities.
Also read: How Telematics Vehicle Tracking Is Redefining Modern Fleet Management?
Why choose Safee for fleet management data analysis?
The Safee Tracking System combines vehicle monitoring with advanced fleet-data analysis, helping organizations across the Middle East, North Africa, and other operating regions understand what is happening across their fleets and investigate the factors behind performance changes.
While basic GPS fleet tracking software may focus mainly on vehicle location and journey history, Safee’s TDA Platform extends the workflow through configurable analysis, dashboards, reports, and filters. This allows managers to connect vehicle tracking data with drivers, routes, alerts, utilization, fuel records, and other supported operational information.
Built on components of the Elastic Stack—including Elasticsearch, Logstash, Kibana, and Beats—the TDA Platform supports the collection, processing, search, and presentation of fleet information. Elasticsearch provides the analytical foundation, while Kibana enables structured data visualization for fleets through charts, maps, tables, and interactive dashboards.
Through dynamic data tracking, managers can move from high-level fleet indicators to the records behind a result. They can compare vehicles, drivers, routes, locations, or time periods and use the findings to investigate recurring exceptions, performance gaps, or operational changes.
This makes Safee more than a vehicle-location tool. It functions as a connected fleet data analytics platform that turns supported GPS, sensor, and operational records into clearer real-time fleet insights for operations, safety, maintenance, and management teams.
The platform does not guarantee lower costs, perfect accuracy, or unlimited scalability. Its value depends on the quality of the connected data, platform configuration, reporting design, and the actions taken by fleet teams after reviewing the results.
FAQs about Safee tracking system
What is the Safee Tracking System, and how does it work?
The Safee Tracking System is a fleet-monitoring and analytics platform that combines GPS tracking, connected vehicle data, alerts, dashboards, and reporting. Its TDA Platform, or Tracking Data Analyzer, organizes information received from compatible GPS devices, sensors, and fleet modules.
Fleet managers can use the platform to review vehicle locations, investigate operating events, compare historical performance, generate reports, and turn raw vehicle tracking data into actionable fleet insights. The exact information available depends on the devices, sensors, integrations, and modules included in the deployment.
What vehicle tracking reports can I generate?
The TDA Platform can generate configurable vehicle tracking reports using the information available from connected vehicles and fleet modules. These may include:
- Trip and journey reports
- Mileage, stops, and idling analysis
- Geofence entry and exit reports
- Vehicle utilization statistics
- Driver-performance records
- Fuel-consumption and purchase reports
- Fleet-resource and maintenance information
- Aggregated reports by vehicle, driver, region, route, or time period
Reports can be filtered, scheduled, and exported in supported formats such as Excel or CSV. The available fields depend on the connected data sources and reporting configuration.
How does Safee provide real-time fleet monitoring?
Safee supports real-time fleet monitoring by receiving data transmitted from compatible GPS devices, onboard sensors, and connected fleet systems. The TDA Platform processes and indexes incoming information so managers can review recent vehicle activity, alerts, journey events, and supported telemetry through dashboards and reports.
Data availability and update frequency depend on device settings, connectivity, transmission intervals, system architecture, and integration configuration. Real-time monitoring should therefore be understood within the technical limits of the selected deployment.
Can Safee Tracking System support large fleets?
The Safee Tracking System can be configured to support growing vehicle numbers, users, devices, dashboards, and reporting requirements. Its TDA Platform uses a distributed data architecture that can be planned around different operational scales.
Actual capacity and performance depend on factors such as:
- Number of connected vehicles and sensors
- Frequency of incoming data
- Data-retention requirements
- Number and complexity of dashboards
- Reporting and export workloads
- Infrastructure and connectivity configuration
Fleet size should be assessed during implementation rather than relying on a fixed or unlimited scalability claim.
Does Safee provide cloud-based dashboards for fleet performance?
Yes. Safee provides cloud-based dashboards for fleet performance through the TDA Platform. Authorized users can review supported fleet information through interactive charts, maps, tables, and filters.
A fleet performance dashboard can be configured around different user responsibilities. Operations teams may focus on vehicle activity and routes, while safety teams review alerts and driver events. Access from desktop, tablet, or mobile devices depends on browser support, user permissions, connectivity, and system configuration.
What makes Safee different from basic fleet data tracking services?
Basic data tracking services may primarily collect and display vehicle locations or standard journey records. Safee extends this process through the TDA Platform, which supports multi-level filtering, comparative analysis, condition-based reporting, interactive dashboards, and scheduled report delivery.
This makes Safee a broader fleet data analytics platform rather than only a location-tracking interface. Its data visualization for fleets helps managers connect information across vehicles, drivers, routes, alerts, and operating periods to identify patterns and investigate exceptions.
The platform supports better analysis, but operational results still depend on data quality, dashboard configuration, and the decisions made by fleet teams.
How can I get started with Safee Tracking System?
Start by defining the information your team needs to monitor, including vehicle locations, journeys, alerts, driver activity, fuel information, or performance reports.
Contact Safee to request a demonstration and discuss your fleet size, vehicle types, connected devices, reporting requirements, dashboards, integrations, and user roles. The Safee team can then propose a configuration based on your operational priorities.
Ready to improve your fleet operations?
Tell us what you would like to improve. A Safee specialist will reply by email.
Usually replies within one business day • No sales spam
Your details are used only to respond to your request. Privacy Policy