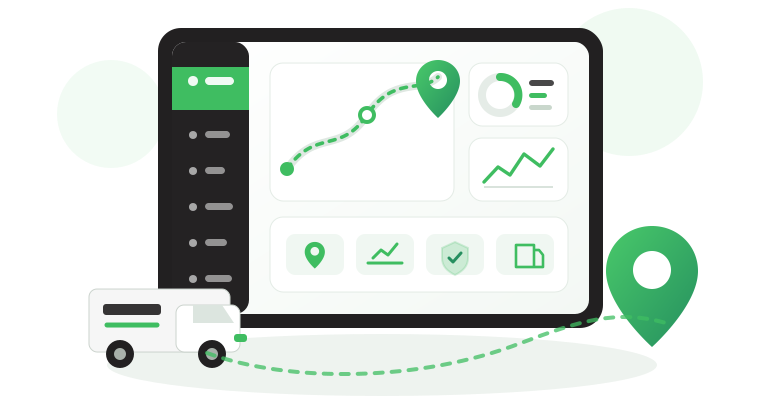


Fleet Management Dashboard: What to Track and When to Act
A fleet management dashboard can display dozens of KPIs yet leave teams unsure which issues need attention. Control room supervisors need to spot urgent operational problems, while fleet managers track exceptions and finance teams investigate cost trends.
The challenge is choosing the right indicators for each role and turning what appears on screen into a clear next action.
In this article, we cover:
- How dashboards differ from reports and live maps.
- Which KPIs each fleet management team needs.
- What Saudi transport operators should monitor on a Wasl dashboard.
- How to configure role-based dashboards and use Safee’s features.
What is a fleet management dashboard?
A fleet management dashboard brings key operational indicators into one view, combining current vehicle status with KPIs measured over specific periods. It helps teams identify exceptions and access the vehicle, driver, or operational records that need investigation.
How is a dashboard different from a report or the live map?
Each tool answers a different operational question:
| Tool | Primary purpose | Example |
|---|---|---|
| Dashboard | Identify fleet conditions and exceptions requiring attention | 12 vehicles idling with engines running |
| Report | Review historical performance and compare results | Last month’s Driver Performance Report |
| Live map | Check vehicle locations and movements | A truck traveling from Riyadh to Dammam |
The dashboard shows what needs attention, the live map provides location and movement context, and reports help examine historical records and patterns. For more on matching reports to responsibilities, read Fleet Management Reporting: Which Report Goes to Whom.
Why does one screen for everyone get ignored?
Combining live alarms, maintenance tasks, driver violations, and monthly costs on one screen makes urgent issues harder to identify.
Build each view around the decisions its user makes. Before adding a KPI, ask: Who needs this information, what action would it trigger, and where can they investigate the underlying data? If a metric has no clear purpose for that role, it does not belong on the screen.
Also read: Fleet Management Tools: What a Fleet Manager Uses Every Week
What should management and fleet managers track?
Management needs a fleet performance dashboard that highlights cost and utilization trends against targets. Fleet managers need a view of operational exceptions, showing which vehicles, drivers, or tasks require follow-up.
Management and finance
Management should prioritize indicators that reveal where spending, vehicle use, or availability is moving off target:
- Operating cost per 100 km: Applies each vehicle’s configured operating cost rate to its distance traveled. Review the rate against actual expenses before using it for budget decisions.
- Fuel cost: Uses fuel consumption and the configured price per liter, where consumption data is available. Compare cost per kilometer to distinguish higher fuel spending from increased mileage.
- Vehicle working hours: Compare actual working hours with planned use to identify capacity that is consistently underused.
- Administrative status: Shows vehicles marked active, broken, in the workshop, or impounded. Check that these records are current before assessing fleet availability.
- Underused vehicles: Identify vehicles with consistently low activity, then check seasonal demand, standby requirements, and branch workloads before considering reassignment or disposal.
For example, if fuel cost per kilometer rises at the Dammam branch while vehicle working hours remain stable, finance should investigate fuel prices, idling, route changes, and vehicle condition before attributing the increase to driver behavior.
For KPI definitions and calculations, see fleet management KPIs. Use the monthly fleet review deck to present trends, off-target indicators, and decisions requiring management approval.
Fleet manager
A fleet operations dashboard should help the fleet manager identify new exceptions and recurring problems rather than review every vehicle’s activity:
- Violations in the last 24 hours: Review speeding, harsh braking, and other events by driver and vehicle. Prioritize repeated or serious violations for investigation.
- Vehicles with an unknown driver: Identify vehicles moving without a confirmed driver assignment and check the shift records before escalating.
- Driver workload: Compare driving hours across drivers to spot uneven assignments and identify schedules that need a closer rest-time review.
- Long idling: Identify vehicles exceeding the company’s idling threshold, then check loading delays, waiting time, or A/C requirements before classifying the time as avoidable.
- Latest alarms: Prioritize alerts that require immediate action and follow up on unresolved exceptions.
- Documents close to expiry: Identify inspections, operating cards, and other documents approaching expiry so renewals can be arranged before they disrupt operations.
- Service due: Identify vehicles with due or overdue maintenance and coordinate with the workshop before the next planned assignment.
Each indicator should lead to the affected vehicle, driver, or task. The last 24 hours reveal new issues; reviewing the week’s recurring exceptions helps the fleet manager decide which require corrective action rather than another reminder.

What should operations, HSE, and maintenance track?
Control rooms need immediate visibility into operational exceptions. HSE teams review driving risks and recurring violations, while workshops track maintenance tasks that may affect vehicle availability.
Control room
The fleet operations dashboard should help supervisors identify vehicles and journeys requiring attention during each shift:
- Vehicle status: Identify moving, idling, and engine-off vehicles, particularly those whose activity does not match the operating plan.
- Connection status: Monitor Online, Delayed, and Offline vehicles. Check the last received message before investigating a communication gap.
- GPS signal: Distinguish poor GPS reception from a communication outage to avoid unnecessary device troubleshooting.
- Latest alarms: Review alerts requiring action, such as speeding or route deviations, according to operational priorities.
- Trip status: Identify journeys in progress and delays requiring follow-up, where the Journey Management System is used.
An Offline truck on a remote route is a visibility gap, not necessarily a breakdown. Check its last reported location, reporting time, and expected coverage before deciding whether to contact the driver or escalate.
HSE
The driver safety dashboard and related IVMS reports should help HSE identify repeated unsafe behavior and verify whether corrective actions work:
- Speeding: Review violation frequency and duration alongside distance driven to identify persistent offenders.
- Harsh braking and acceleration: Investigate repeated events and their operating context before treating them as evidence of unsafe driving.
- Continuous and cumulative driving hours: Identify drivers exceeding configured limits and review their schedules and rest records.
- Colored driver rating: Use RAG classifications to prioritize drivers for review, applying the safety thresholds required by the company or client.
- IVMS Road Safety Report: Review yearly driver scores to assess longer-term patterns alongside monthly safety reports.
Prioritize serious or recurring violations, verify the events, and assign corrective actions. Then compare subsequent results to determine whether driver coaching has improved performance.
For driving and rest controls, use the driver fatigue management plan. For broader safety exposure, see fleet risk management.
Workshop
The fleet maintenance dashboard should help workshop teams identify overdue work and coordinate servicing before it disrupts vehicle availability:
- Due tasks and status: Review new, in-progress, and resolved maintenance tasks to monitor outstanding work.
- Overdue tasks: Prioritize open tasks by their impact on vehicle safety, readiness, and upcoming assignments, not simply how long they have been overdue.
- Odometer and engine hours: Track service intervals against actual vehicle usage, where the required data is available.
- Cost of completed tasks: Review recorded parts and additional costs to identify vehicles requiring repeated or expensive maintenance.
A vehicle approaching routine service may only need a scheduled workshop slot. An unresolved safety-critical defect requires attention before the vehicle returns to service. The dashboard should support that distinction, rather than treating every due task as equally urgent.
To tie this screen to a full service plan, read about fleet maintenance management software.
What Should a Wasl Dashboard Track?
For Saudi transport operators subject to Wasl requirements, installing tracking devices is not enough. Fleet teams need to verify that vehicle data reaches Safee and that the expected updates are successfully transmitted to Wasl.
A Wasl dashboard helps monitor five areas:
- Vehicles by Wasl status: Track vehicle states such as Moving, Device No Signal, and Device Not Working to identify vehicles requiring investigation.
- Vehicles by last successful update: Compare vehicles reporting to Safee with those successfully sending updates to Wasl. A gap helps identify where transmission needs checking.
- Successful and failed messages: Monitor message results over periods from 12 hours to one month. Investigate rising failures using the message history and available error details.
- Vehicle and driver registration: Compare registered and unregistered records, focusing on vehicles and drivers covered by the applicable Wasl requirements.
- Devices with no signal: Review the percentage of time each vehicle spent in the Device No Signal state during the past month to prioritize recurring connectivity problems.
For example, if 40 registered vehicles have recent updates in Safee but only 31 show successful Wasl updates within the same reporting window, the team should check individual vehicle timestamps and message records to identify the gap.
Assign responsibility for reviewing these indicators to the operations or compliance team. When a problem appears, check the latest device data, Wasl message status, and vehicle registration details before escalating the unresolved issue to the tracking provider.
For activity-specific requirements, read about the Wasl platform in Saudi Arabia and verify the current official rules. To review Safee’s Wasl monitoring tools, request a Safee Fleet Demo.

How to set up dashboards by role
A role-based fleet dashboard should reflect the decisions each team makes, not simply the data available in the system. Set it up in five steps:
- Define roles and decisions: Identify who monitors each issue and what decisions they need to make. A control room supervisor handles live exceptions; finance investigates cost trends.
- Select relevant KPIs: Keep indicators that support those decisions. Check that the underlying vehicle, driver, or cost data is reliable before using it.
- Set review periods: Use live data for urgent operational issues, daily or weekly views for recurring exceptions, and monthly comparisons for management trends.
- Configure permissions: Restrict access by role, branch, or vehicle group. Ensure users can access the records needed for their responsibilities.
- Test and refine: Ask each team whether its dashboard helps identify and investigate problems. Remove irrelevant indicators, but retain critical ones even if they are rarely needed.
Use the fleet KPI calculator to compare indicators against your targets. For a structured investigation process, see turning fleet analytics into action.
Dashboard, alert, or report?
Choose how to present each indicator based on when it needs attention:
- Alert: Notify the responsible team when a configured condition requires prompt action, such as a serious speeding event or route deviation.
- Dashboard: Monitor fleet status and exceptions that need regular review, such as offline vehicles or recurring violations.
- Scheduled report: Compare performance over defined periods, such as monthly operating costs or driver safety trends.
The same metric may appear in more than one place. A speeding event can trigger an alert, appear in the daily dashboard, and contribute to a monthly safety report.
Excel dashboard vs. fleet platform
| Comparison | Excel dashboard | Fleet platform dashboard |
|---|---|---|
| Data sources | Manual imports or configured connections | Integrated vehicle and operational data |
| Updates | Manual or automated, depending on setup | Based on connected data feeds and reporting intervals |
| Access control | Workbook sharing and configured access | Role, branch, and vehicle-group permissions |
| Best suited to | Periodic KPI analysis and management reviews | Ongoing fleet monitoring and operational follow-up |
Excel can support monthly management reviews, while an integrated fleet platform reduces the need to assemble operational data manually.
Safee’s monthly fleet KPI report template calculates 11 indicators, compares results with targets and previous months, and includes an action log for management decisions.
How Safee supports fleet dashboards by role
At Safee, we combine fleet dashboards, specialized reports, and configurable alerts so teams can monitor the data relevant to their responsibilities without relying on the same screen.
- Dashboard: Displays fleet status, driver assignments, connection health, and violations through widgets filtered by the user’s permitted sites or vehicle categories. Widgets can be exported as PNG or Excel files.
- Vehicle Dashboard: Provides a closer view of an individual vehicle, including driving activity, violations, and historical data for periods of up to three months.
- WASL Dashboard: Helps Saudi transport operators monitor registered vehicles and drivers, vehicle status, and successful or failed messages sent to Wasl.
- Maintenance Dashboard: Shows due and overdue maintenance tasks and their status, helping workshop teams identify outstanding work.
- Fuel Tracking Dashboard: Summarizes consumption, refueling, and fuel-related events by vehicle or driver, depending on available device and sensor data.
- Permissions, alerts, and reports: The Administration Panel controls user access and fleet organization. Alarms and Alerts notifies responsible teams when configured conditions are detected, while Fleet Reporting supports scheduled reports and exports.
Which Safee view fits each role?
| Role | Safee screen or report | What it helps them check |
|---|---|---|
| Management and finance | Dashboard and Operation Cost Report | Vehicle utilization, operating cost trends, and fleet status |
| Fleet manager | Dashboard and Alarms and Alerts | Violations, driver assignments, and exceptions requiring follow-up |
| Control room | Dashboard and Monitoring page | Vehicle status, connectivity, GPS signal, and active alarms |
| HSE | RAG reports and IVMS Road Safety Report | Repeated driving violations and driver safety trends |
| Workshop | Maintenance Dashboard and Maintenance Reports | Due tasks, overdue work, and maintenance costs |
| Wasl officer | WASL Dashboard and Wasl Vehicle Messages Report | Registration gaps, message failures, and transmission status |
The available indicators depend on user permissions, enabled modules, and compatible devices or sensors. Your team defines the operational targets and response procedures; Safee provides the monitoring, alerts, and reporting tools to support them.
Request a Safee Fleet Demo to see which dashboards and reports fit your team’s responsibilities.

FAQs about fleet management dashboards
Should every role check the fleet dashboard every day?
No. Control rooms monitor live conditions throughout their shifts, while fleet managers review operational exceptions daily or as needed. Management and finance typically review trends monthly, with earlier follow-up when significant exceptions arise.
Can each user see different widgets on the dashboard?
Safee administrators can restrict access through user permissions and permitted sites or vehicle categories. This controls which fleet data and features users can access, but does not mean every user can freely customize all widgets.
What happens when vehicle data is delayed or offline?
The dashboard identifies Delayed or Offline vehicles based on message timing and configured thresholds. Check the last received update before treating the displayed position as current or investigating a communication problem.
Does Safee set the targets for my fleet’s indicators?
No. Your management defines KPI targets and acceptable operating limits. Safee displays supported indicators and generates alerts according to the thresholds configured for your operation.
Ready to improve your fleet operations?
Tell us what you would like to improve. A Safee specialist will reply by email.
Usually replies within one business day • No sales spam
Your details are used only to respond to your request. Privacy Policy